Class of 2030 Profile
Basics
85 students
- Legal Sex:
- 46% women
- 54% men
- Gender:
- 42% women
- 49% men
- 8% another gender (i.e. genderqueer, nonbinary, agender)
- 1% not provided
- 41% are students of color (U.S. citizens and permanent residents only)
- 11% are underrepresented students of color (U.S. citizens and permanent residents only)
- 15% are first-generation college students
- 15% are Pell eligible
- 8% are international students
By home address:
- 22 U.S. States are represented
- Top 5 states represented (descending order): Massachusetts, California, New York, Connecticut, Maine
- Countries represented (alphabetical): China, India, South Korea, United Kingdom, United States
Academics
Middle 50%:
- Unweighted GPA: 3.97–4.07
- SAT*: 1510-1540
- ACT*: 34-35
*Among those submitting test scores.
- 67% of applicants submitted test scores
Activities
Students in the Class of 2030 participated in the following activities before coming to Olin:
| 81% Community Service | 52% Competitive Robotics Teams |
| 9% Environmental | 26% Computer/Technology |
| 2% LGBT | 48% Athletics |
| 52% Part-Time Work | 28% Instrumental Music |
| 22% Research | 11% Visual Arts |
| 14% Student Government | 8% Publications Staff |
| 14% Speech & Debate | 20% Drama |
| 5% Dance | 5% Family Responsibilities |
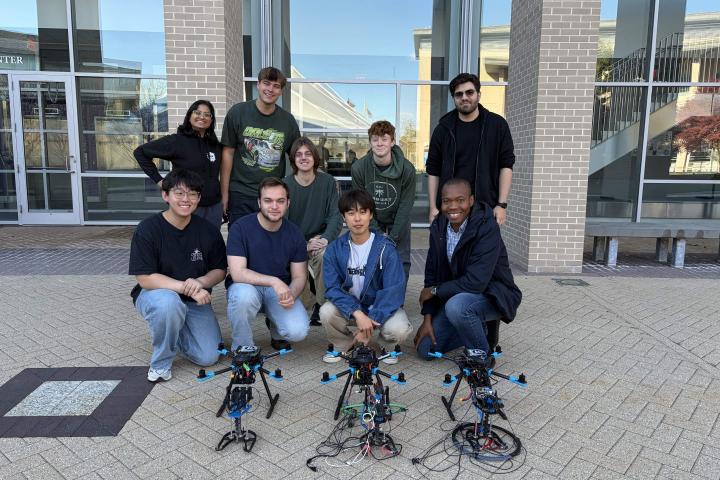
Wondering if Olin is the right fit for you?
Every college has its own culture. At Olin College of Engineering, students come from many different backgrounds and pursue many different interests, but the students who thrive here often share several qualities. If you enjoy asking questions, collaborating with others, creating and bringing new ideas to life, and making a meaningful impact in the world, you may find yourself at home at Olin.